
Connecting, managing and transforming data into reliable, actionable insight

RINA helps clients organize, manage, integrate, and use data more effectively across infrastructure, utility, industrial, transportation, and campus environments. Our team supports the full data lifecycle, from collection, conversion, migration, and database design to governance, analytics, visualization, and long-term system maintenance. By combining technical data expertise with practical knowledge of engineering, construction, operations, and asset management, RINA helps clients improve data quality, connect systems, strengthen reporting, and turn information into actionable insights.

As one of the largest broadband providers in the United States, Comcast is responsible for accurately reporting service availability and speeds for millions of addresses nationwide to the Federal Communications Commission (FCC) twice each year. Reporting broadband service availability for millions of addresses nationwide requires the ability to process, validate, and analyze address, network, and serviceability data at exceptional scale and precision. We provided design and development support for this big-data reporting platform, leveraging Databricks and other tools to transform massive volumes of data into accurate, auditable, and repeatable regulatory submissions while meeting strict timelines and improving overall data reliability.
Beyond regulatory reporting, the same big-data architecture and analytical expertise support a wide range of strategic initiatives across Comcast. our agile development approach enables rapid proof-of-concepts and production-ready solutions for competitive market evaluation and serviceability modeling. By improving data quality, streamlining maintenance processes, and optimizing processing performance, we help Comcast accelerate insight generation and adapt quickly to evolving business and regulatory needs, turning regulatory infrastructure into a foundation for broader operational and strategic value.
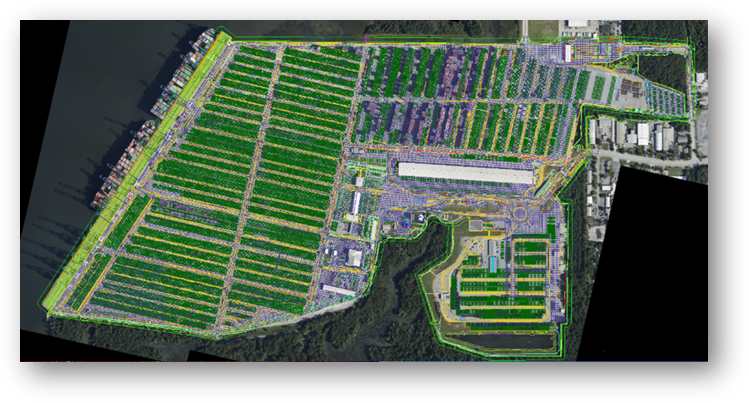
The SCSPA GIS Manager needed support on a number of data oriented activities that were time consuming. The we GIS and Digital Team helped establish the repeatable scripts for the repeatable activities that dramatically improved time spent and data quality of the outcomes. These scripts included:
Data Update Script - This modified an existing model builder tool that updated data from external and subscription sources. This modified both the data and the metadata while archiving previous versions.
AutoCAD ETL Script - Our team needed a flexible ETL to migrate vendor-supplied CAD data to an authoritative central geodatabase. Requirements mandated that the solution be developed using Esri's ArcPy toolset. The final tool used flexible parameters and reused functions to create a modular, expandable script. Instead of prescriptive hard-coded settings for each input and output table, our team's script can be adapted for any input and output geodatabases. Using a JSON configuration file, non-developer end users are empowered to extend the script themselves, improving maintainability.
MXD Export - The client asked to develop a standalone Python 2.7 script that can publish PDF and PNG files from existing ArcMap MXD layouts. The script will iterate through all map files in a specific directory at one time and output to a directory of choice.
AGOL Numbering Script - Develop an ArcGIS Pro Toolbox Python script that will populate the asset identifiers in ArcGIS Online (AGOL) as new assets are added. The end result will be a script that automatically populates the asset identifier field with the next sequential number within the Port's AGOL feature class.
All scripts are held within a toolbox function on the client's ArcPro application.
As part of the Redefine Southside Partners Joint Venture (RSPJV), we were tasked with both construction management and tracking for the Chicago Transit Authority's 5.5 mile Red Line Extension project. While materials, designs, and permits were tracked in multiple systems, RSPJV needed a way to quickly visualize where there may be conflicts and track construction progress in near real-time.
We were responsible for creating an ETL process that converted tabular data into hosted GIS layers that were embedded in interactive ArcGIS Dashboards. Deploying ArcGIS Hub further enabled RSPJV staff to identify potential delay hotspots and served as a central hub for construction progress - summarizing overall utility relocations, pier construction activities, and parcel acquisitions. Lastly, the use of ArcGIS Field Maps allowed field crews to update this information in real-time, providing office personnel with immediate insight into field activities. This implementation of the ArcGIS ecosystem empowered teams to make faster and smarter decisions to keep construction on track.


